
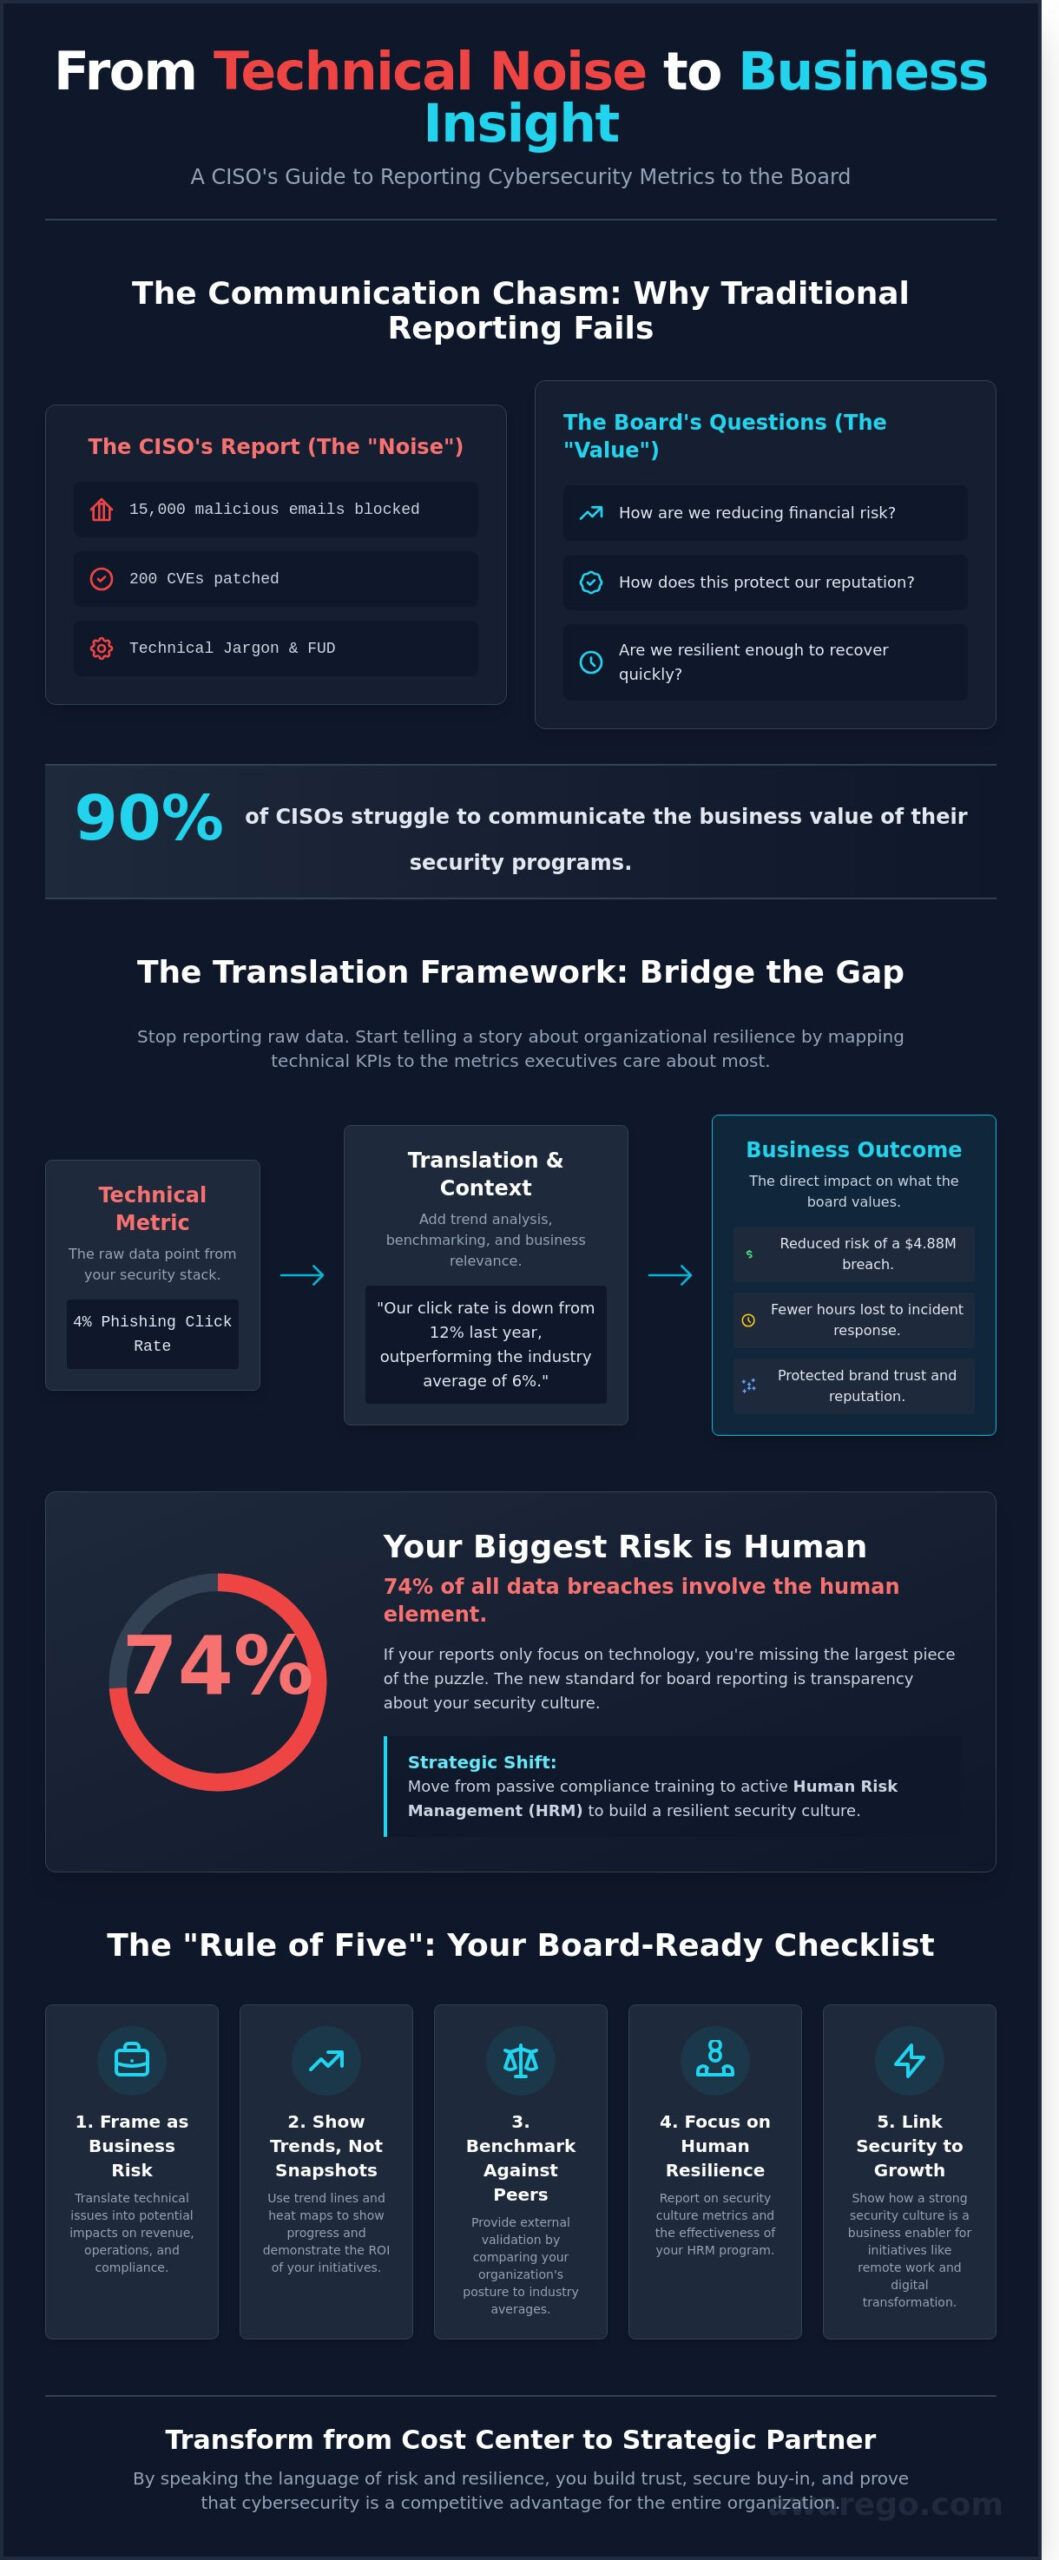
Your board doesn’t care about the 15,000 malicious emails your firewall blocked last Tuesday. While those numbers feel like progress to a technical team, a 2023 survey found that 90% of CISOs still struggle to communicate the actual business value of their security programs. If you want to stop being seen as a cost center, you must master the art of reporting cybersecurity metrics to the board by speaking the language of risk and resilience.
You probably feel the disconnect every time you present technical data only to be met with questions about the bottom line. It’s frustrating to justify a security budget when the leadership team treats your department like an insurance policy rather than a strategic partner. This article teaches you how to transform raw data into a narrative that secures buy-in and proves your program’s worth. You’ll learn a repeatable framework for your next presentation, including how to measure the human element through Human Risk Management (HRM) to build a lasting security culture.
Key Takeaways
- Stop losing your audience to technical jargon and start framing digital uncertainty as a manageable business risk.
- Use the “Translation Framework” to map technical KPIs directly to the metrics executives care about most: money, time, and reputation.
- Transition from passive compliance to active Human Risk Management by focusing on the human behaviors that drive the majority of breaches.
- Streamline your presentation with the “Rule of Five” to master reporting cybersecurity metrics to the board using clear trend lines and heat maps.
- Learn how real-time intelligence can automate your risk scoring, replacing manual reporting with a continuous narrative of organizational resilience.
Why Traditional Cybersecurity Reporting Fails in the Boardroom
Reporting cybersecurity metrics to the board often feels like a translation exercise gone wrong. When you walk into the room with a list of 5,000 blocked phishing attempts or 200 patched CVEs, you aren’t showing value. You’re showing noise. This creates a Communication Chasm where technical output fails to meet executive expectations. Directors don’t live in the world of bits and bytes. They live in the world of revenue, reputation, and resilience.
Board-level cybersecurity isn’t a technical checkbox. It is the active management of digital uncertainty to protect business value. When you focus on technical jargon, you trigger executive disengagement. They want to know how digital threats impact the company’s ability to operate. Your job is to turn technical data into business intelligence. This means moving away from Fear, Uncertainty, and Doubt (FUD) and toward a strategy rooted in confidence, clarity, and culture.
You must also avoid the “Are We Safe?” trap. It’s a binary question that leads to a credibility dead end. If you say “yes” and a breach occurs, you’ve failed. If you say “no,” you look ineffective. Instead, frame the conversation around risk appetite and maturity. Use Information Security Indicators to show progress and measurable trends. Reporting cybersecurity metrics to the board should focus on how you’re reducing the probability of an event, not promising it will never happen.
The Disconnect Between CISOs and Directors
Directors care about the bottom line. CISOs often focus on the perimeter. This gap is no longer sustainable. The 2026 regulatory landscape demands that boards treat cyber as a core enterprise risk rather than an IT nuisance. More data doesn’t lead to better decisions. In fact, 60% of board members say they feel overwhelmed by the technical reports they receive. They need streamlined insights that connect human behavior to financial outcomes. The 2023 Verizon Data Breach Investigations Report notes that 74% of breaches involve a human element. If your board reports don’t reflect this reality, you’re missing the biggest piece of the puzzle.
The New Standard for Cybersecurity Transparency
New mandates like the SEC July 2023 disclosure rules and the October 2024 NIS2 directive are forcing a shift toward total transparency. Transparency is the new currency of trust. You don’t need to be perfect; you need to be resilient. A resilience-first mindset acknowledges that threats exist but proves your organization can bounce back quickly. This approach builds long-term confidence with stakeholders. By sharing honest data about your security culture and human risk management, you transform from a technical enforcer into a strategic business partner. It makes security a shared responsibility rather than a siloed department task.
Translating Technical Metrics into Business Risk
Boards don’t speak Python or SQL. They speak the language of risk, specifically how it impacts money, time, and reputation. When you’re reporting cybersecurity metrics to the board, your primary goal is translation. You aren’t just presenting data; you’re telling a story about organizational resilience. By aligning your reporting with the NIST Cybersecurity Framework, you create a common language that bridges the gap between technical controls and business outcomes.
Context is your most valuable asset. A single data point, like a 4% phishing click rate, means very little in isolation. The board needs to see the direction of travel. Is that 4% an improvement from 12% last year, or a slip from 2% last month? Prioritizing trend analysis allows you to demonstrate the effectiveness of your Human Risk Management (HRM) strategies over time. It transforms a static report into a dynamic roadmap of your security culture’s evolution.
Benchmarking provides the external validation boards crave. They want to know how the company stacks up against its peers. In 2024, the average cost of a data breach reached $4.88 million, according to IBM. Using these specific industry figures helps you answer the “Are we doing enough?” question with data rather than intuition. It moves the conversation from “we spent this much” to “we are protecting this much value.”
Security isn’t just a defensive shield; it’s a business enabler. Effective security habits allow for faster employee onboarding and more secure remote work environments. When you link security investments to these operational wins, you position the security team as a partner in growth. Building a strong security culture helps you turn these numbers into a competitive advantage that the board can easily get behind.
The Board-Ready Metric Map
- Technical Metric: Patching Cadence. Business Outcome: Operational Continuity. Keeping systems updated isn’t just about code; it’s about ensuring the 24/7 availability of revenue-generating services.
- Technical Metric: Phishing Click Rate. Business Outcome: Human Capital Resilience. Lower click rates mean your workforce is a proactive defense layer, reducing the risk of costly ransomware disruptions.
- Technical Metric: SOC Alert Volume. Business Outcome: Detection Efficiency and Cost Control. Streamlining alerts ensures your team focuses on real threats, maximizing the value of your existing security spend.
Quantifying the Financial Impact of Risk
Cyber Risk Quantification (CRQ) is the process of putting a dollar sign on digital threats. Instead of using “High” or “Medium” labels, you use “Expected Loss” models to show the potential financial hit from a specific threat. For example, if there’s a 10% annual probability of a breach that costs $2 million, your expected annual loss is $200,000. This logic makes it easier to justify a $50,000 investment in a new security habit program.
You measure ROI in security by calculating loss avoidance rather than traditional profit gain. This perspective shift is crucial for long-term strategic planning. When you present metrics this way, you show the board that security is a calculated investment in the company’s stability. It changes the perception of your department from a cost center to a vital safeguard of the company’s future.
The Missing Link: Reporting on Human Risk Management (HRM)
The 2023 Verizon Data Breach Investigations Report confirms that 74% of all breaches involve a human element, yet internal audits show that 90% of security spending and reporting still focuses on hardware and software. When reporting cybersecurity metrics to the board, you must bridge this gap between technical defense and human reality. You’re likely reporting on the strength of your locks while your front door is being left wide open by the people holding the keys.
Human Risk Management (HRM) is the proactive orchestration of human behavior to reduce cyber exposure. It moves your strategy beyond a yearly “check-the-box” video and into a continuous cycle of measurement and habit-building. By treating employees as your strongest defense rather than your weakest link, you shift the narrative from blame to empowerment. This approach allows you to present a more accurate picture of organizational resilience.
The centerpiece of this strategy is the Human Risk Score. This single, digestible metric aggregates data points like simulated phishing clicks, password hygiene, and training engagement into one number. If your organization’s score is 78 in Q1 and drops to 64 in Q2, you have a clear, data-driven story to tell about your security culture. It’s a metric that speaks the board’s language of risk and performance.
Remediation metrics are equally vital. Don’t just show the risk; show how you’re fixing it. For instance, if 18% of your staff failed a credential-harvesting simulation in January, your report should show how targeted interventions reduced that failure rate to 3% by June. This demonstrates a tangible return on investment when reporting cybersecurity metrics to the board.
From Awareness to Behavioral Change
Training completion rates are vanity metrics. They tell you someone pressed “play,” not that they learned anything. Boards should ignore them because they don’t correlate with reduced risk. Instead, quantify your security culture by measuring “Report Rates.” A high volume of employees reporting suspicious emails is a better indicator of a healthy culture than 100% training completion. Micro-learning facilitates this by delivering 2-minute lessons that fit into a busy day, building habits without causing cognitive fatigue.
Benchmarking Human Risk Across the Enterprise
Risk isn’t uniform across your company. A 2023 IBM X-Force report found that Finance departments are targeted 300% more than other sectors. Your reporting should reflect these nuances. Use benchmarking to identify high-risk groups, such as comparing the risk scores of Engineering versus Sales, to allocate resources where they matter most. When you present phishing data, avoid the “Wall of Shame” approach. Focus on the “Catch Rate” to celebrate employees who spotted the threat. This builds confidence and turns your staff into a resilient human firewall.
- Risk Score: A consolidated view of behavioral risk.
- Reporting Rate: The percentage of employees who flag real or simulated threats.
- Behavioral Change: The measurable drop in high-risk actions over 6-month intervals.
By focusing on these human-centric data points, you provide the board with a transparent view of the organization’s true security posture. You move away from abstract technical jargon and toward a narrative of measurable, human-led resilience.
Designing a Boardroom-Ready Cybersecurity Dashboard
Your board doesn’t want a data dump. They want clarity. Effective reporting cybersecurity metrics to the board requires a shift from technical jargon to business risk. You need to respect the “Rule of Five.” This means limiting your presentation to the five most impactful metrics that directly influence business continuity and financial health. If you present twenty charts, you’ve already lost their attention. Focus on what moves the needle.
Visualizing resilience is your primary goal. Use heat maps to show risk density across different departments. A heat map might show that your finance team has a high Human Risk Score, while your R&D department is showing 15% better resilience. Use trend lines to demonstrate progress over time. A single data point is just a number; a trend line is a story. If your phishing click rate dropped from 24% in Q1 to 8% in Q3, that line tells a story of a strengthening security culture.
Every presentation must follow a narrative arc. Start with the context of the external threat environment. Move to your current state using real data. Define your targeted outcome, such as reaching a specific maturity level by a set date. Finally, present your resource requirement. This structure prevents the board from feeling lost in the weeds. It keeps the conversation focused on strategic alignment rather than technical minutiae.
The Four-Slide Board Deck Template
Slide 1 sets the stage by comparing external threats to your internal capabilities. Slide 2 focuses on the human element, highlighting your Human Risk Score and behavioral trends. Slide 3 covers operational health, including Mean Time to Detect (MTTD) and Mean Time to Respond (MTTR). Slide 4 is “The Ask.” This is where you connect your budget requirements to specific strategic goals, ensuring the board sees security as an investment rather than a cost center.
Storytelling with Data
Numbers feel cold until you add a human element. Use micro-stories to make metrics tangible. Instead of just saying your reporting rate increased, tell the story of a junior accountant who flagged a sophisticated “CEO fraud” email within 90 seconds. This 90-second response saved the company from a potential $50,000 fraudulent wire transfer. This makes the data relatable and proves that your training is working in the real world.
Apply the “So What?” test to every slide. If a metric doesn’t clearly explain how it protects the bottom line, cut it. When you must handle bad news, such as a failed internal audit or a minor security incident, do it with professional authority. Don’t hide the 12% increase in unauthorized software use. Instead, explain why it happened, what the immediate remediation steps were, and how you’re adjusting your Human Risk Management (HRM) strategy to prevent a recurrence.
Pre-empting questions from the board chair is the final step in dashboard design. They will likely ask about ROI and peer benchmarking. According to the 2023 Verizon Data Breach Investigations Report, 74% of all breaches include a human element. Use this concrete data to justify your focus on human-centric metrics. By anticipating these questions, you transition from a technical reporter to a trusted strategic advisor.
Ready to transform your data into a compelling narrative? Explore how our Human Risk Management platform provides the precise metrics you need for your next board meeting.
Scaling Your Reporting with AwareGO’s Human Risk Intelligence
AwareGO transforms how you handle human risk by turning abstract behaviors into concrete, actionable data. It automates the Human Risk Score; this ensures you always have real-time data ready for the boardroom. You don’t have to scramble for spreadsheets or manual tallies before a high-stakes meeting. Instead, you present a live pulse of your organization’s resilience. Reporting cybersecurity metrics to the board doesn’t have to be a manual, stressful process. Our platform translates complex employee behaviors into clear, executive-level insights, bridging the gap between technical reality and strategic decision-making.
Global benchmarking allows you to see exactly where you stand. You can instantly compare your human risk profile against industry standards. This context is vital for the board. They need to know if your 12% phishing click rate is a success or a warning sign compared to your peers. In 2024, 74% of all breaches involved a human element according to the Verizon DBIR. By using targeted micro-learning, you demonstrate a clear ROI through measurable risk reduction. Organizations using AwareGO often see a 60% improvement in security habits within the first six months. You aren’t just checking a compliance box; you’re actively shrinking the attack surface.
Data-Driven Human Risk Assessments
AwareGO’s platform identifies specific behavioral vulnerabilities before they become entry points for attackers. We look at the psychological drivers behind the risk. Whether it’s poor password hygiene or a lack of physical security awareness, the data is granular and specific. Reporting cybersecurity metrics to the board becomes simpler with customizable views. You can provide high-level summaries for directors while giving detailed risk maps to HR or IT. This data integrates seamlessly into your existing GRC framework. By treating human risk with the same rigor as financial risk, you ensure it stays on the permanent agenda. Our 2024 data shows that 68% of employees feel more confident in their security roles when assessments are frequent and supportive rather than punitive.
Building a Sustainable Security Culture
Security shouldn’t be a source of anxiety for your workforce. We help you move away from quarterly, fear-based reports that only highlight failures. Instead, you build a continuous, empowerment-based narrative. This shift changes the CISO’s role entirely. You become a supportive partner to the business rather than a strict enforcer of rules. When employees feel capable, they report threats faster. This makes reporting cybersecurity metrics to the board a strategic conversation about growth and resilience. By making security training snackable and frequent, you build a culture that lasts long after the training ends. See how AwareGO transforms human risk into board-ready intelligence.
Master Your Narrative of Resilience
Effective reporting cybersecurity metrics to the board requires moving past technical jargon to focus on business impact. You’ve seen how traditional methods fail when they don’t connect to the bottom line. By prioritizing Human Risk Management (HRM), you address the 68% of breaches that involve a human element according to the 2024 Verizon DBIR. You don’t need to spend weeks preparing static slides. Instead, use a Real-time Human Risk Score to give your board an instant, data-driven view of your security culture. Hundreds of global enterprises use AwareGO’s behavioral science-backed micro-learning to transform passive awareness into active habits. This approach doesn’t just check a compliance box; it builds a measurable shield around your most valuable assets.
Download our CISO Guide to Boardroom Reporting to start building your dashboard today. You’re ready to lead with confidence and clarity. Your board deserves a narrative of strength, and you have the tools to show them exactly how your strategy reduces risk every single day.
Frequently Asked Questions
What are the most important cybersecurity metrics for board members?
Focus on metrics that align security with business objectives, such as your organization’s Human Risk Score and the potential financial exposure from a data breach. Boards prioritize high-level trends over technical logs. You should present data like the 82% of breaches involving human elements reported in the 2023 Verizon DBIR. This helps them understand that investing in a strong security culture reduces the likelihood of a $4.45 million average breach cost.
How often should a CISO report to the board of directors?
You should present a formal update to the board at least once every quarter. This 90 day cadence ensures that security remains a consistent part of the strategic conversation rather than an afterthought. Between these sessions, provide monthly high-level dashboards to keep leadership informed of shifting risks. Regular reporting cybersecurity metrics to the board builds trust and ensures that your Human Risk Management (HRM) strategy stays funded and prioritized.
How do you explain a cybersecurity breach to the board?
Start with the facts regarding the scope of the incident and the immediate steps taken to contain it. Explain the why behind the event without getting lost in technical jargon. If a phishing attack led to the breach, show how the response plan minimized downtime. Mention that the SEC now requires material incident disclosure within 4 business days. Focus on how this event strengthens your long term resilience and security culture.
What is the difference between a KPI and a KRI in cybersecurity?
A Key Performance Indicator (KPI) measures how well your security team is doing, while a Key Risk Indicator (KRI) predicts potential future problems. For example, a KPI might track that 95% of employees completed their micro-learning modules this month. In contrast, a KRI would monitor a 15% increase in suspicious login attempts from unfamiliar regions. Both are essential for reporting cybersecurity metrics to the board to show both progress and emerging threats.
How can I measure the ROI of my cybersecurity awareness program?
You measure ROI by tracking the reduction in high-risk behaviors and the associated cost savings from avoided incidents. If your program leads to a 50% drop in phishing clicks over 6 months, you’ve lowered the probability of a costly attack. Compare the annual cost of your HRM platform against the $1.3 million average cost of a business email compromise. This data proves that proactive training is a financial safeguard, not just a compliance checkbox.
Should I use technical dashboards during a board meeting?
Avoid using granular technical dashboards that focus on firewall logs or individual patch counts during board meetings. These metrics often confuse non-technical directors and obscure the bigger picture. Instead, use visual summaries that highlight organizational resilience and human risk levels. Directors need to see trends and outcomes, such as how a 20% improvement in your security culture score correlates with a lower overall risk profile for the company.
How do I report on human risk without sounding like I am blaming employees?
Frame human risk as a collective opportunity for growth rather than a list of individual failures. Use terms like security habits and resilience to describe employee behavior. If a department shows a high risk score, explain it as a need for more tailored support and micro-learning rather than a lack of discipline. This approach positions you as a supportive partner. It shows the board that you’re building a culture where security is a shared responsibility.